Prime Video Analytics
Executive Summary
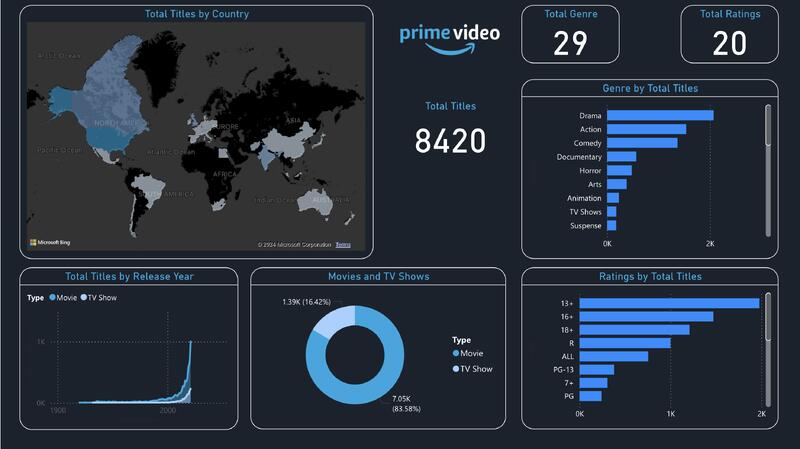
This dashboard analyzes the Amazon Prime Video content library, focusing on the distribution of genres, ratings, and content types (Movies vs. TV Shows). It helps identify gaps in the library and opportunities for acquiring high-demand content.
The Challenge
Amazon Prime Video needs to constantly balance its library between original content and licensed material. Understanding which genres are most prevalent and how they are rated is crucial for maintaining subscriber engagement.
The Solution
I created a Power BI dashboard that breaks down the library by genre, rating, and release year. It includes interactive filters to drill down into specific categories like "Drama" or "Action".
Key Insights & Features
- Total Titles Overview: Shows total number of titles (8420), total genres (29), and total ratings (20).
- Country Distribution: World map showing the number of titles available per country.
- Release Year Trends: Line chart showing the addition of titles over time (large spike near recent years).
- Movies vs TV Shows: Donut chart comparing Movies vs TV Shows (with Movies being the majority).
- Genre Breakdown: Bar chart highlighting key genres like Drama, Action, Comedy, Documentary, Horror, Arts, Animation, Suspense.
- Rating Analysis: Breakdown of maturity ratings (13+, 16+, 18+, PG, ALL, etc.).
Tools & Technologies
Power BI: Interactive reporting and visualization.
Data Cleaning: Processed raw datasets to ensure accuracy in reporting.
Conclusion
The Prime Video Analytics dashboard provides a clear, data-driven picture of the platform's library. It is an essential tool for understanding market positioning and informing future content acquisition strategies.