Context
This dashboard summarises the Netflix catalogue across title type, genre, ratings, release patterns, and regional distribution.
Dashboard Work
Power BI dashboard analysing content mix, ratings, release trends, and country-level distribution across Netflix titles.
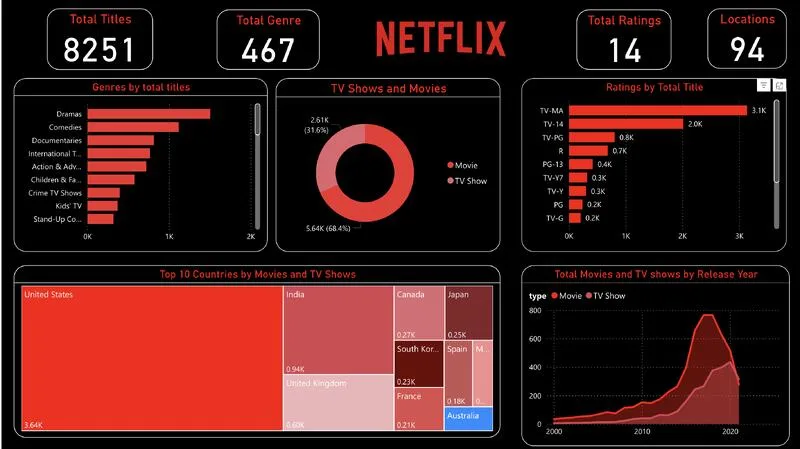
This dashboard summarises the Netflix catalogue across title type, genre, ratings, release patterns, and regional distribution.
Large catalogue datasets are difficult to read in raw form. The task was to organise the main signals into a report that could be scanned quickly.
What I did
Interactive report showing content mix, ratings, and regional patterns in one place.
This project shows how I turn a large dataset into a readable dashboard that supports quicker review and clearer decisions.