Context
This dashboard summarises the Disney+ Hotstar catalogue through genre mix, ratings, release patterns, and title distribution.
Dashboard Work
Reporting project built to show content trends, genre mix, ratings, and regional catalogue patterns.
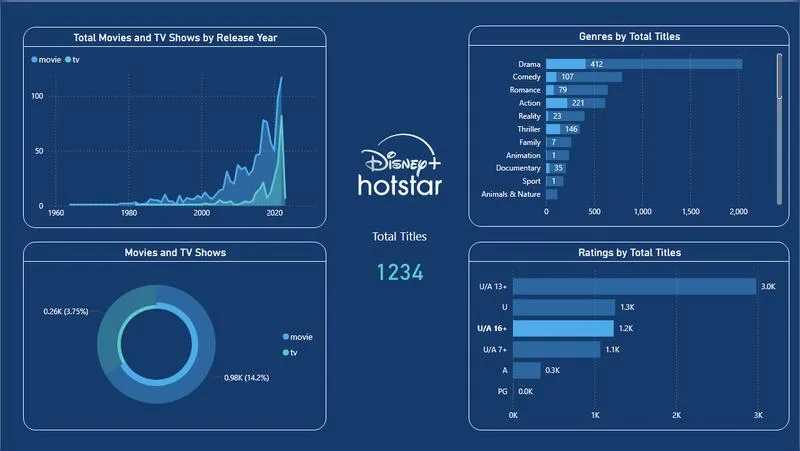
This dashboard summarises the Disney+ Hotstar catalogue through genre mix, ratings, release patterns, and title distribution.
A large content library is hard to interpret without clear summaries. The task was to make the key patterns visible in one readable dashboard.
What I did
Interactive report showing catalogue mix, ratings, and release patterns.
This project shows how I condense a broad dataset into a dashboard that is easier to scan and discuss.